The science behind the climate emergency
At a recent Renew branch meeting in Canberra, Climate Councillor and Emeritus Professor Will Steffen explained why the science supports declaring a climate emergency.
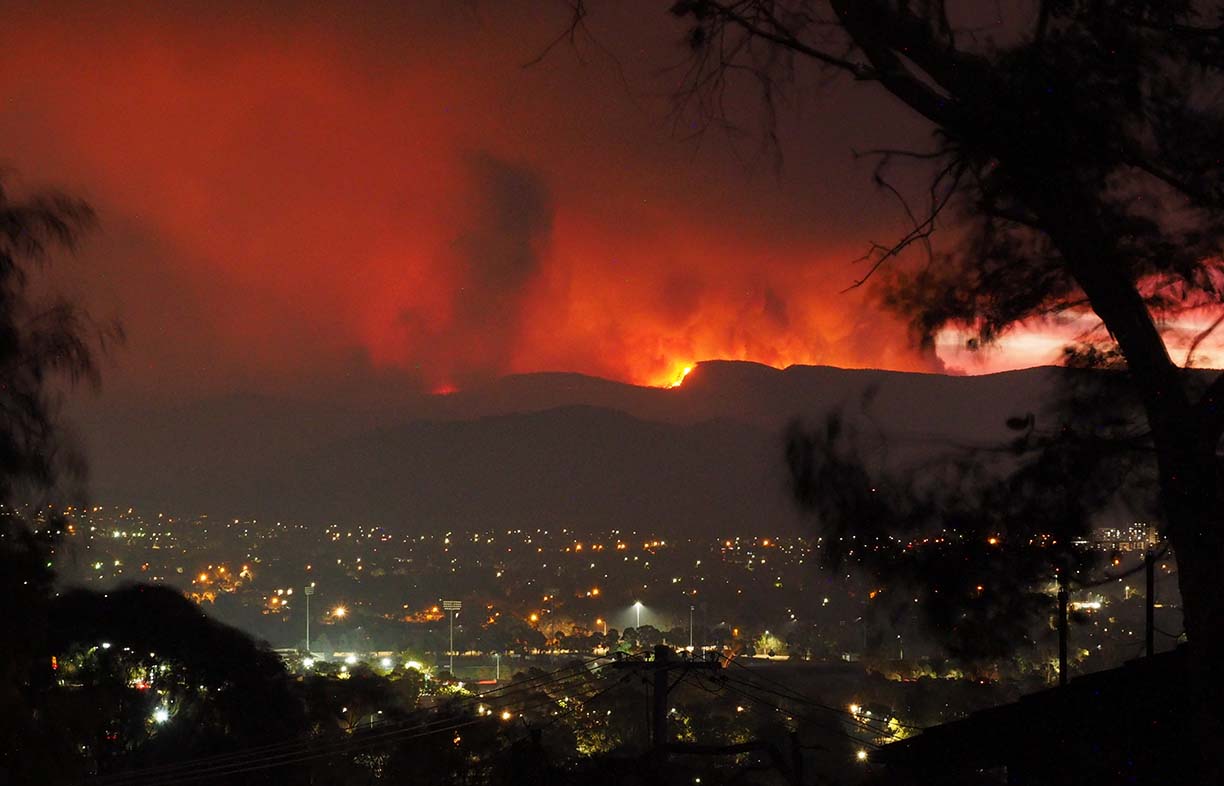
A lot of us are focused these days on the Covid-19 health emergency, but, as Will Steffen notes, it wasn’t so long ago that Australians were out on the streets with signs like ‘We are on fire—act now.’ “Just three months ago,” says Will, “we were in the midst of a very deep climate-related emergency.”
Photos, satellite images and statistics tell the story of the bushfires in summer 2019/20. A remarkably large area was burnt: over 21% of the temperate broadleafed forests in eastern Australia, compared to only 2% in an average year. Fires directly and bushfire smoke indirectly have led to about 400 extra related deaths already. Nearly 3000 dwellings and several villages were destroyed and over a billion animals lost their lives from the fires. And the fires doubled Australia’s annual CO2 emissions—in the order of 500 million tonnes of CO2 were emitted during the fires, about equivalent to the country’s annual emissions. This was an “extraordinary, extreme event, the likes of which we haven’t seen before,” says Will.
Extraordinary heat and dryness
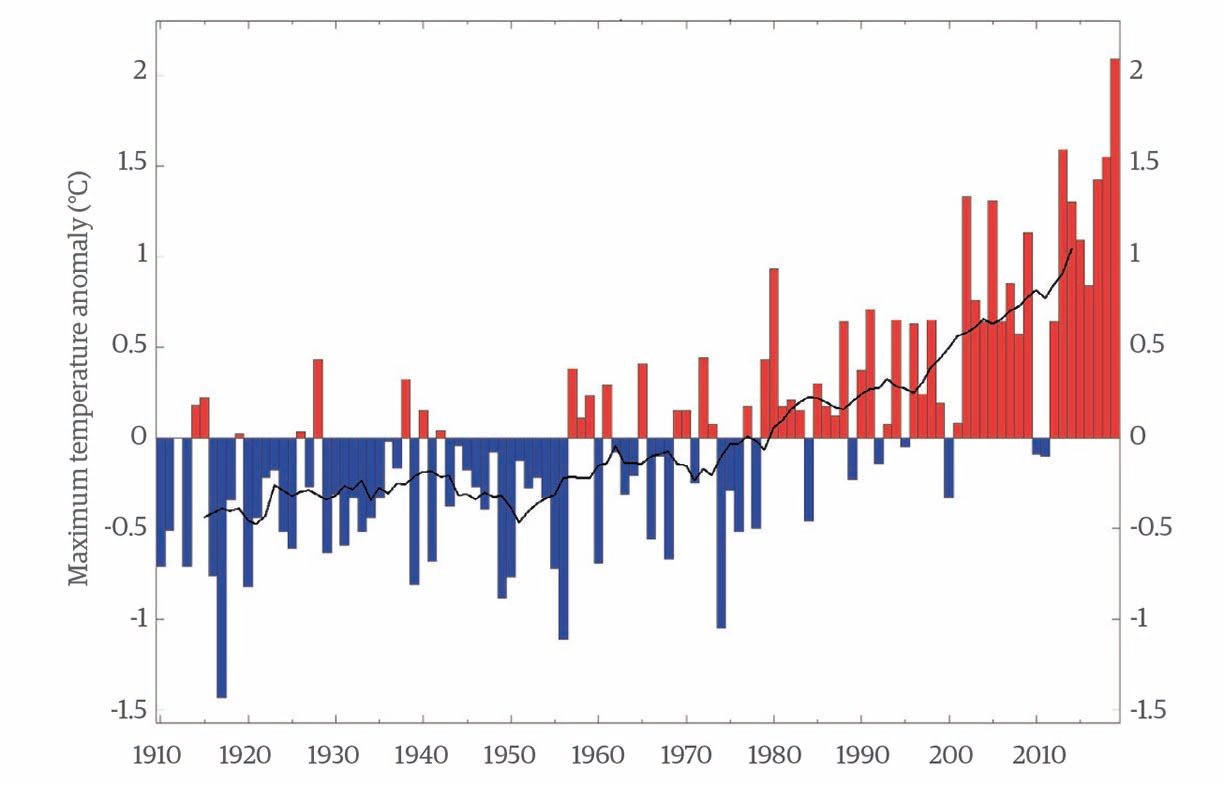
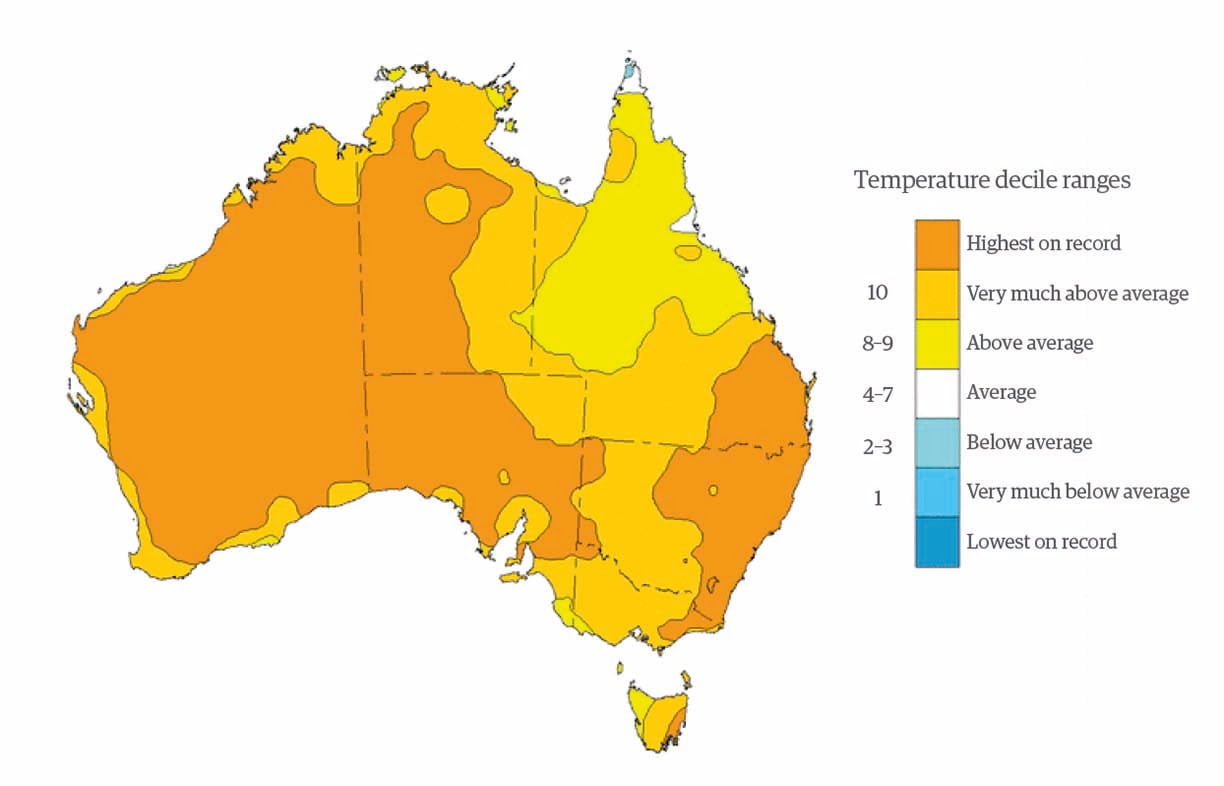
So what is the climate data that stands behind this bushfire season? Figure 1 shows temperature anomalies for the years from 1910 to 2019 in Australia. The year 2019 saw an “extraordinary record,” says Will, with maximum temperatures in Australia more than 2 °C above the 1961–1990 average maximum (more detail in Figure 2).
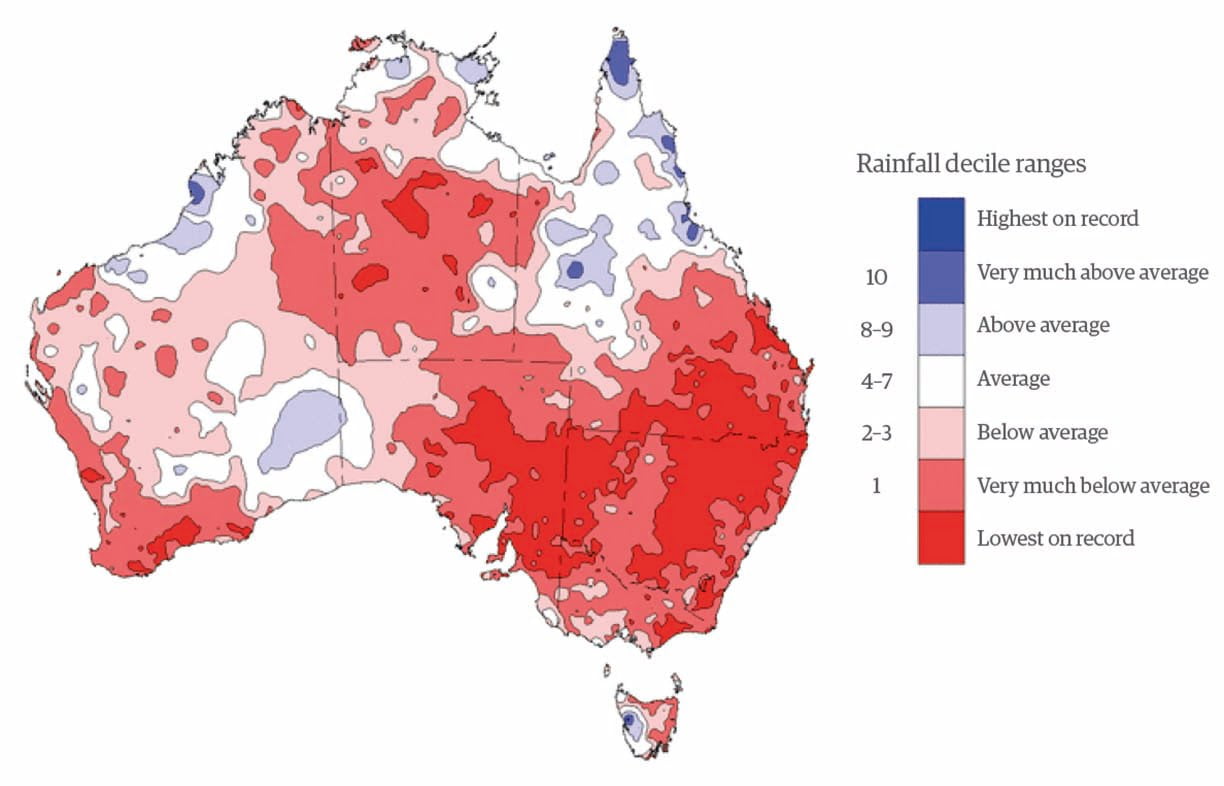
And Figure 3 shows just how dry it had been in the two years leading up to the fires. For much of Australia and much of the area burnt, rainfall was the lowest on record. “Climate change was setting up these regions for uncontrollable fires,” says Will.
And it’s not just the fires. One climate-related catastrophe that crept under the radar due both to the bushfires and the Covid-19 crisis, notes Will, was a mass bleaching event on the Great Barrier Reef in early 2020. The reef recorded the highest monthly sea surface temperatures ever and for the first time had bleaching along its entire length.
This is the third bleaching event in the last five years. “The gaps between bleaching events are shortening. It’s going to be virtually impossible for it to recover, given what’s happening now and what’s already locked into the climate system,” says Will.
He reiterates: “What’s behind all this? We know it’s the change in the global climate that’s being driven by human activity.”
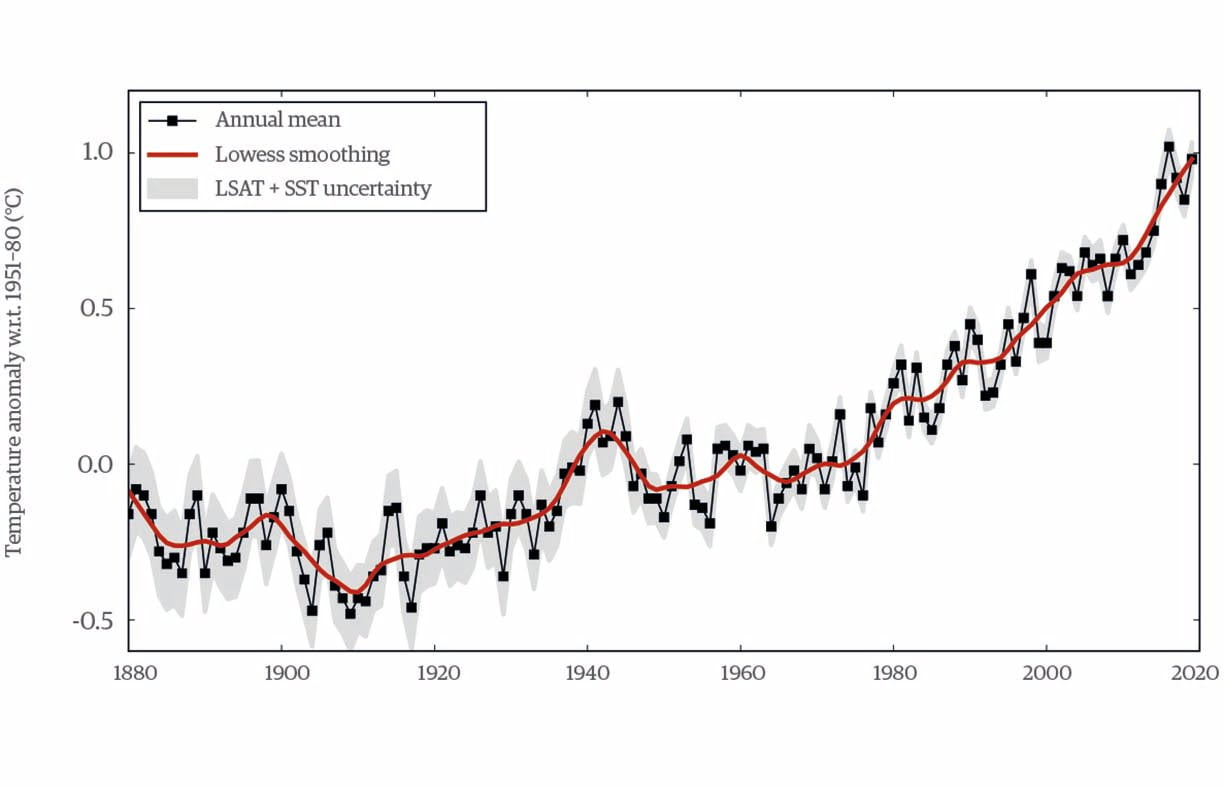
Figure 4 shows the long-term global temperature record from 1880, when records started, up to 2017. “We see a lot of short-term variability, but the long-term trend from the mid 20th century on is an undoubted very strong temperature increase.”
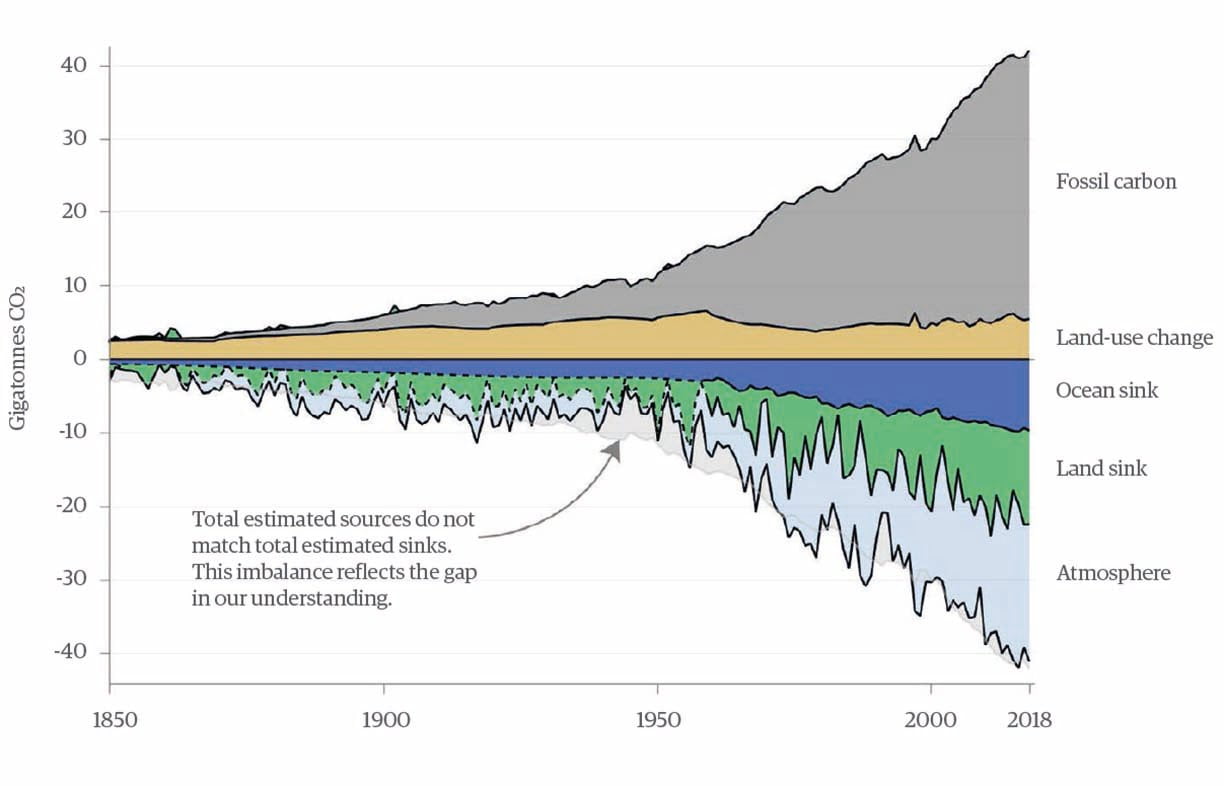
That graph’s curve has the exact same shape as Figure 5, showing the increase in greenhouse gas emissions over the same period. Will says, “Of course, correlation doesn’t prove cause and effect, but physics tells us that there is indeed a cause and effect here, due to the enhanced greenhouse effect.”
Will explains that it’s “climate change 101”: as these greenhouse gases, primarily CO2, increase in concentration around the mid and low troposphere around the planet, they absorb more outgoing heat radiation from the earth’s surface and retain more heat in the lower atmosphere and at the earth’s surface. “This has been known for 200 years; this isn’t rocket science. And it manifests itself in the sort of extreme weather events we’ve been seeing in Australia and many parts of the world.”
Nature’s dangerous decline
Will adds that climate change isn’t the only major human-driven change to the earth. Just as dramatic, but more in the background, is “nature’s dangerous decline.” In 2019, the equivalent of the IPCC for the biosphere (Intergovernmental Science-Policy Platform on Biodiversity and Ecosystem Services) released its report into what was happening to the living part of the earth, the biosphere. “The take-home message was clear: nature is declining globally at rates unprecedented in human history. Around one million animal and plant species are threatened with extinction, many within decades, for the first time driven by a biological species itself, homo sapiens.”
That change is being wrought through human domination of the biosphere: “When we look at what the human transformation of the biosphere looks like, over half of the earth’s surface is now completely dominated by human activity,” says Will. Only about 3% of terrestrial vertebrate biomass (that’s the weight of everything on land that has a backbone, basically birds, mammals, reptiles and amphibians) is from wildlife; 67% is from domesticated animals and 30% from humans.
In addition, humans now commandeer somewhere between 25% and 40% of all net primary production of the biosphere. “Coal, oil and gas was once part of the biosphere and we’re mining and releasing their byproducts back into the atmosphere, with knock-on effects to the biosphere via climate change.”
Observed temperature spikes well outside the envelope of natural variability
The temperature data going back over 400,000 years puts contemporary climate change in a longer term context. Temperature can be inferred from hydrogen and oxygen isotopes in ice cores from Antarctica.
“From these ice cores, we see a very regular pattern of short warm periods and long ice ages. We humans have been through two of those periods of warm and ice ages since modern humans evolved 250,000 years ago.” Then, 11,700 years ago we entered a period of relative stability and wetness, the Holocene, and that enabled us to develop agriculture, villages and cities.
“But what we’re now doing to that 11,700 year period of stability is quite remarkable,” says Will.
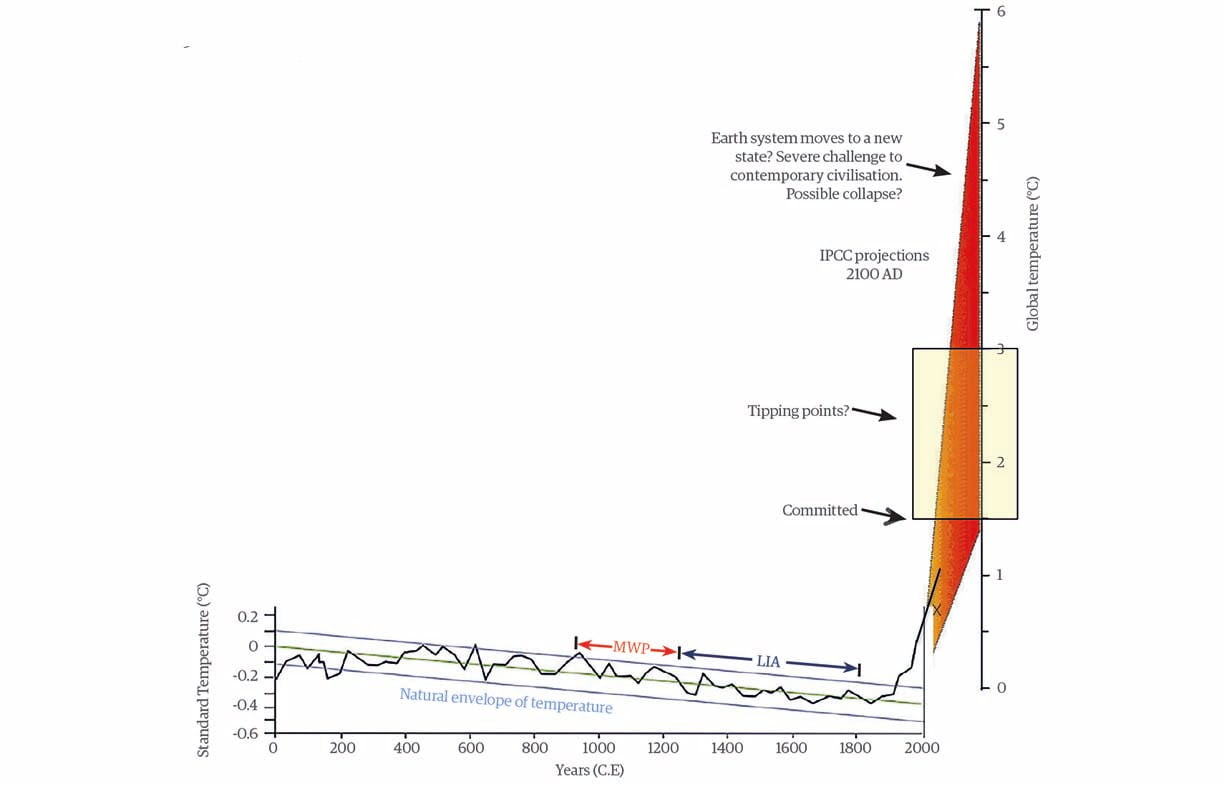
Recent spikes in temperature are dramatically different to the natural variability (Figure 6). Over the last 2000 years (and further back in that 11,700 year range), the climate changed, but only within about plus or minus a tenth of a degree, and with a slight cooling trend. But, from the mid to late 1900s, there’s a significant spike in temperature due to contemporary climate change driven by humans, primarily by burning of fossil fuels.
“This is why animals can’t cope, this is why fires are getting dangerous, this is why sea levels are rising, this is why we’re seeing all the instabilities we’re seeing now. This is well outside the envelope of variability to which our biosphere has adapted and in which we have built our societies and civilisations,” says Will.
Already this is a big hit to the earth system, says Will. But if we look towards the future, it gets increasingly dangerous.
Projecting forward
Figure 6 also shows modelled projections in temperature rises from the IPCC, added to the 2000-year graph. “All the projections, even those for 1.5 °C, show a huge spike in temperature, the likes of which you rarely see in earth’s history, going back tens of millions of years. The last time we saw anything like this was about 55 to 56 million years ago, in an event called the Palaeocene–Eocene Thermal Maximum.”
We are already committed to a 1.5 °C increase, says Will: “We can’t avoid that, given the momentum in our economic system and the momentum in the climate system. We still have a shot at limiting temperature rise to 1.5 °C to 2 °C, but only if we get our act together really fast. The projections include the really dangerous area of 4 °C to 5 °C, which many people think could lead to a collapse of our global civilisations.”
Tipping points
Some of the most important science pointing to a climate emergency, says Will, is around tipping points. These are features of the earth system that could put additional CO2 and other gases into the atmosphere—they could melt ice and uncover darker ocean water or land—and thus accelerate warming. “These tipping points could possibly take the trajectory of the earth’s warming out of human control and up towards much hotter temperatures,” says Will.
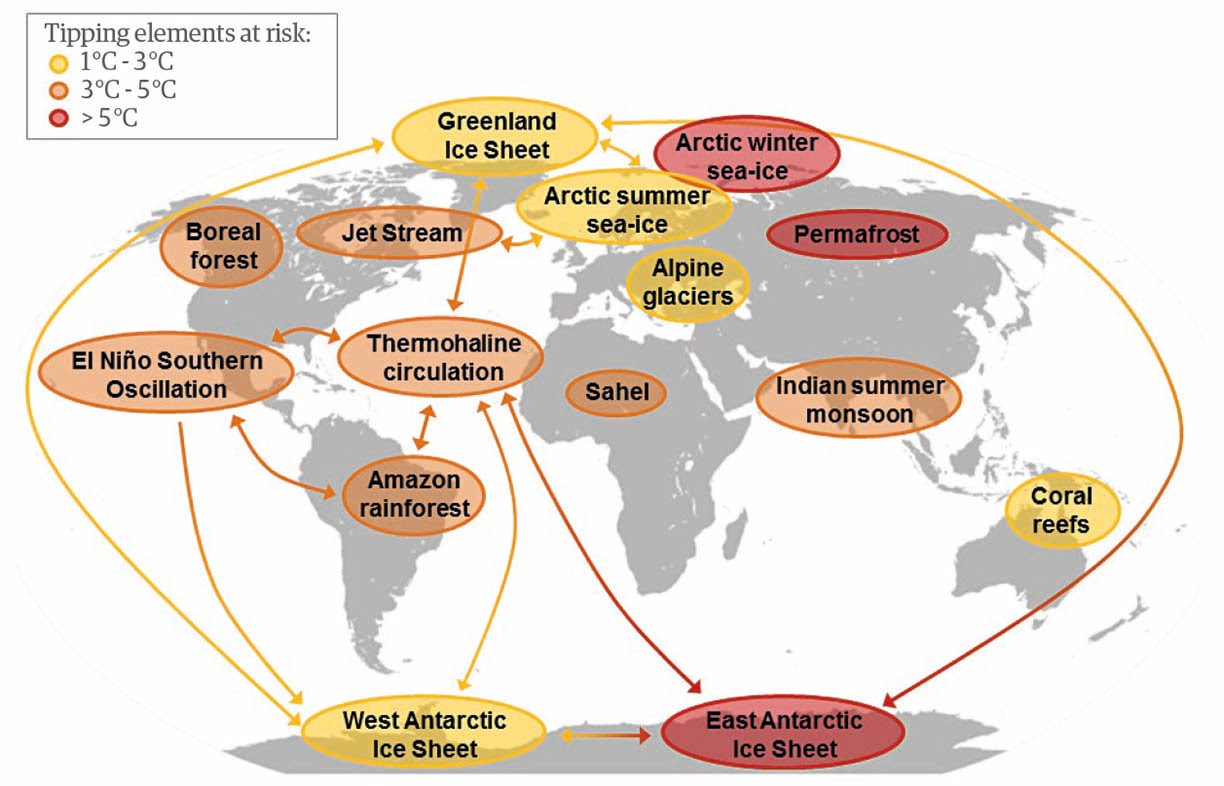
There’s been a lot of work in the last five to ten years on these tipping points and what they might look like (Figure 7). Systems that are prone to tipping points include big sheets of ice like the west and east Antarctic ice sheets, floating Arctic sea ice, permafrost (basically frozen peat), the Amazon rainforest, circulation systems in the atmosphere and the ocean, and coupled systems like the El Niño–Southern Oscillation (ENSO). “All of these we think can be prone to sudden shifts if they get pushed hard enough by a changing climate. If we start triggering some of these, they take us to a much hotter climate even if we get our emissions down.”
The IPCC has assessed the risk of many of these tipping elements, which they refer to as large-scale singular events. Already at a rise of 1 °C, which is where we are now, the IPCC says there is a moderate risk of tipping some of these, but the risk becomes high at 2.5 °C.
With the current trajectory we’re heading to 2.5 °C warming, so this is a real risk that we are facing: “an existential threat to civilisation.” In that case, says Will, no amount of economic cost-benefit analysis is going to help us. “Figure 7 really summarises some of the strongest evidence we have that we are in a climate emergency now.”
Will contributed to a recent publication in Nature which described what’s happening with each of these tipping points right now. The Greenland ice sheet is seeing ice loss accelerating; Arctic sea ice is seeing a reduction in area; the permafrost is thawing; Atlantic circulation is slowing down; and the Amazon is seeing more frequent droughts. “Not only are these tipping points theoretically possible, but we’ve seen them operating in the past in the Palaeo records and we’re also starting to see them become active in current observations.”
Will reiterates: “These tipping points could trigger a cascade that could take the climate out of our control into conditions that are an existential threat to us. Well, if that isn’t an emergency situation, I don’t know what is.”
A big problem, notes Will, is that the intervention time for many of these tipping points (the time we need to act to avoid tipping them) is much less than the 30 years that we will likely need to reach net-zero emissions. For Arctic sea ice, it could be zero years: we could be right at the tipping point today. With West Antarctica, ice loss is accelerating, and it could be only 10 years until we hit that tipping point. For the Amazon it might be 15 years, though there’s a lot of uncertainty about that; it could be less or more. The Greenland ice sheet is more stable, but by 25 years we could have tipped that. The question becomes: “Are we already losing control of the system?”
A useful analogy for tipping points comes from the Titanic disaster: if it takes five kilometres to change direction, but we only realise that the ship is in trouble when it’s three kilometres from the iceberg, then the ship is doomed.
Are emissions coming down?
How are we tracking dealing with the emergency? “Not too well,” says Will. We’re seeing increasing emissions, at an increasing rate; that is, exponential growth. “And yet we have to turn this around really fast.”
The year we peak emissions is really critical. One boon of our current Covid-19 situation is that 2020 emissions will be less than 2019. “So if we can use that as a start to a deep emissions trajectory and get to net zero by 2040 rather than 2050, we will be in the middle of the Paris target, somewhere between 1.5 °C and 2 °C.” If we dither around for just five more years, just an electoral cycle or two, to 2025, then we must decarbonise by 2035 in 10 years—”and that’s impossible.”
“This is just another way to say that we are in an emergency. We cannot miss the opportunity that Covid-19 is giving us. If we go back to business as usual, which some governments are already saying, we will miss the Paris targets.”
Will adds: “The students are right—we are in a climate emergency. They sensed this intuitively and the science supports this. They’re also right that we need system change. We don’t need fiddling with this present system at the edges.”
Using Covid-19 to guide the way
Will’s talk looks at the lessons we can learn from the way we’ve handled Covid-19 in Australia that could be applied to the climate emergency.
What’s the same? We need to respect the science, something that happened quickly and decisively with Covid-19, and we need to act before the real crisis hits. We’ve heard ‘flatten the curve’ ad infinitum. For climate change, we need to flatten the temperature and emissions curve before we hit climate change that we can’t control.
As with Covid-19, dealing with the climate emergency needs to take precedence over other aspects of society, such as the economy, sport and education. It was amazing how quickly this happened under the threat of Covid-19—the same sort of response is needed for the existential threat that is climate change.
One big difference that makes it harder to get the same response is that the Covid-19 threat is immediate and threatens humans directly and clearly, whereas climate change is what’s known as a “long fuse, big bang crisis”, although increasingly serious impacts are occurring. They need to be named to make people aware of the impacts.
Another difference from Covid-19 is one that works in favour of action on climate change. Unlike action to suppress Covid-19 which is damaging the economy, meeting the climate challenge can lead to a healthier, more dynamic society and economy. “The wonderful work done by Ross Garnaut and Frank Jotzo shows that we have the technologies and we can envision the changes required, but we don’t have the politics to drive this. This could be really positive if we do it well.”
What would flattening the curve look like?
Finally, Will describes what’s needed to flatten the climate change curve.
- From 2020: No new fossil fuel developments of any kind (coal, oil, or gas).
- By 2030: 50% reduction in greenhouse gas emissions, with 100% renewable energy. This is absolutely technologically feasible, economically achievable and has lots of benefits in terms of employment and the resilience of the energy grid.
- By 2040: reach net zero emissions.
Adapted by Robyn Deed from a talk by Will Steffen for the Renew Canberra branch (see youtu.be/x94fcoIG9GQ).
Further reading
 Pears Report
Waiting for a replacement isn’t a climate strategy
We can’t afford to wait for ‘end of life’ transition, especially for buildings and long-life trucks, writes Alan Pears.
Read more Pears Report
When the market is no longer the main player
Distributed energy, smart appliances and shared storage are creating parallel energy systems that challenge the central role of electricity markets, writes Alan Pears.
Read more Sustainable tech
Distributed renewables in Africa
Co-founder of CrossBoundary Group Matthew Tilleard speaks with Nathan Scolaro about how distributed renewables are reshaping energy access across Africa—and what Australia can learn from it.
Read more