

Solar monitoring basics
You don’t have to be a solar monitoring obsessive to get useful information from your solar system. Lance Turner explains the basics of solar monitoring.
This article was first published in Issue 142 (Jan-Mar 2018) of Renew magazine.
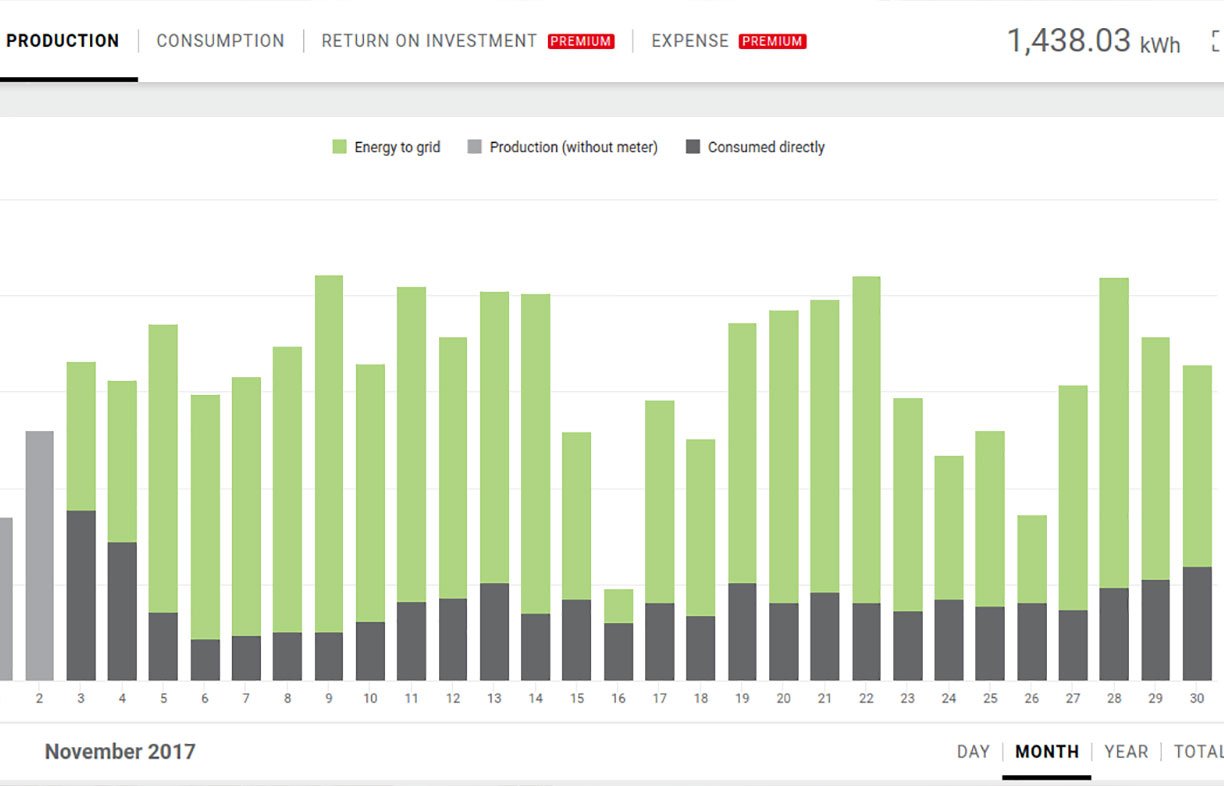
You can use monitoring not only to track how much green energy you’ve generated for interest/boasting purposes, but also to review your feed-in payments, match generation to usage and check that the system is working—you’ll know there’s an issue of some kind if output under similar conditions drops off significantly.
Simple manual recording
There’s nothing more basic than looking at your inverter once a day and noting down the energy produced (just after the inverter stops generating for the day). You can enter this information into a spreadsheet and produce nice graphs, or you can create a PVoutput account and enter your totals manually, letting PVoutput create a range of graphs for you. In the photo below you can see the daily total as shown on an SMA Sunny Boy inverter’s LCD, but most inverters have a similar display.
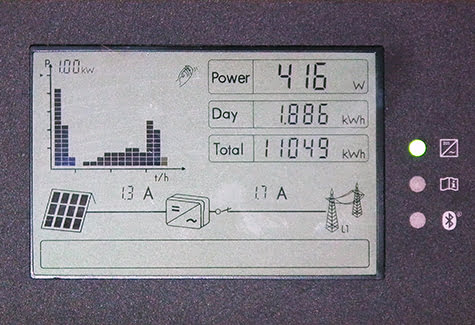
The main disadvantage of such a system is that there is a manual component to the data collection, but for some people this is a positive as it encourages them to keep a close eye on the system.
Automated uploading
If you keep forgetting to record your daily total or feel you have better things to do, then some form of automation is in order. There are a number of options, depending on your inverter and software available—some are simpler to set up than others.
Manufacturer or add-on monitoring
Some inverter manufacturers provide a free (or sometimes requiring a monthly fee) portal for data monitoring. A great example of this is the Fronius Solarweb portal (see feature image), which shows you energy flows between the home, the grid, the inverter and the battery (if fitted), as well as energy generated. In this case, the inverter and associated monitoring device does everything and the system is completely automated—the data just appears online (or in an app) in almost real time. For many people, this sort of system is ideal, but it is best set up at time of system installation, and will often add a (usually modest) cost to the system. You can also get add-on monitoring not tied to a particular inverter e.g. Solar Analytics, Reposit or CarbonTrack. See Energy Monitoring in Renew 141 for more options.
Semi-automated data collection
This lies somewhere between the two aforementioned approaches. It can be a combination of software, either supplied by the system manufacturer or created by the system owner or a third party.
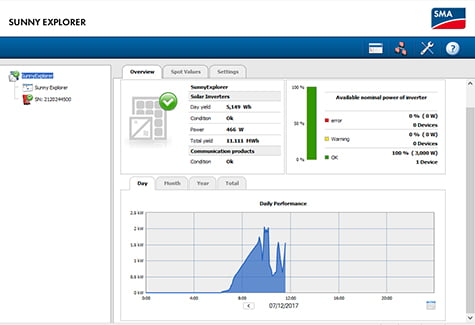
An example of this is how I collect data from my own system, an SMA Sunny Boy inverter with Bluetooth. Once a week I use SMA’s Sunny Explorer Windows software to talk to the inverter via Bluetooth and download the data onto a Windows tablet. Sunny Explorer creates a series of text files, one for each day, which it places in a designated folder.
Next, I run a nice little program called PV Bean Counter, third-party software which allows inverter data from a range of systems to be uploaded to PVoutput. In my case, it reads the text files created by Sunny Explorer and adds that data to its own database, while moving the text files to an archive folder so that it doesn’t read them again next time. It then talks to PVoutput (via my wi-fi network and the internet), checks to see what the last data was that it uploaded, and uploads the new data. In a few minutes I have all the new data for the past week added to my PVoutput graphs. For some inverters (including Fronius, Aurora and Growatt), PV Bean Counter will talk directly to them, often through a hard-wired serial port, so intermediary software like Sunny Explorer isn’t required.
Other options
There are other ways to set up either automated or semi-automated data collection and upload. ReNew readers have used single-board computers such as the Raspberry Pi or Arduino to automate the task, and there are third-party programs that allow these to access the inverter and extract data for uploading to PVoutput.
Lastly, PVoutput features an API-based auto-uploader service that automates live data uploads from multiple sources to PVOutput. The service is configured online and removes the need to run additional monitoring software on local hardware. More information on supported hardware here.
It’s well worth monitoring your system, so when getting a new system we recommend asking your installer about integrated monitoring. Who knows, you may even find yourself joining the Whirlpool group of solar obsessives!
This article was first published in Issue 142 (Jan-Mar 2018) of Renew magazine. Issue 142 is our landlords and renters special.
Recent articles on solar and batteries
 DIY
DIY
Deleting the genset
If you have the need for the occasional use of a generator, then why not replace it with a much cleaner battery backup system instead? Lance Turner explains how.
Read more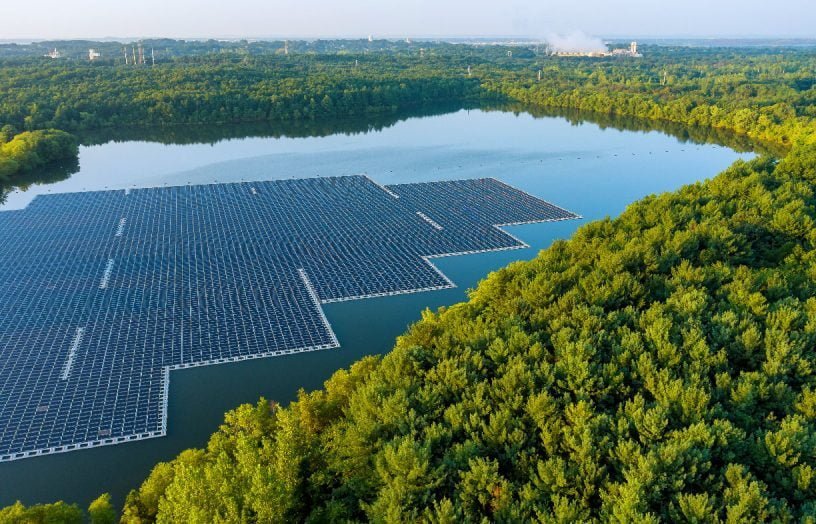 Renewable grid
Is a floating solar boom about to begin?
Rob McCann investigates the world of floating solar energy systems.
Read more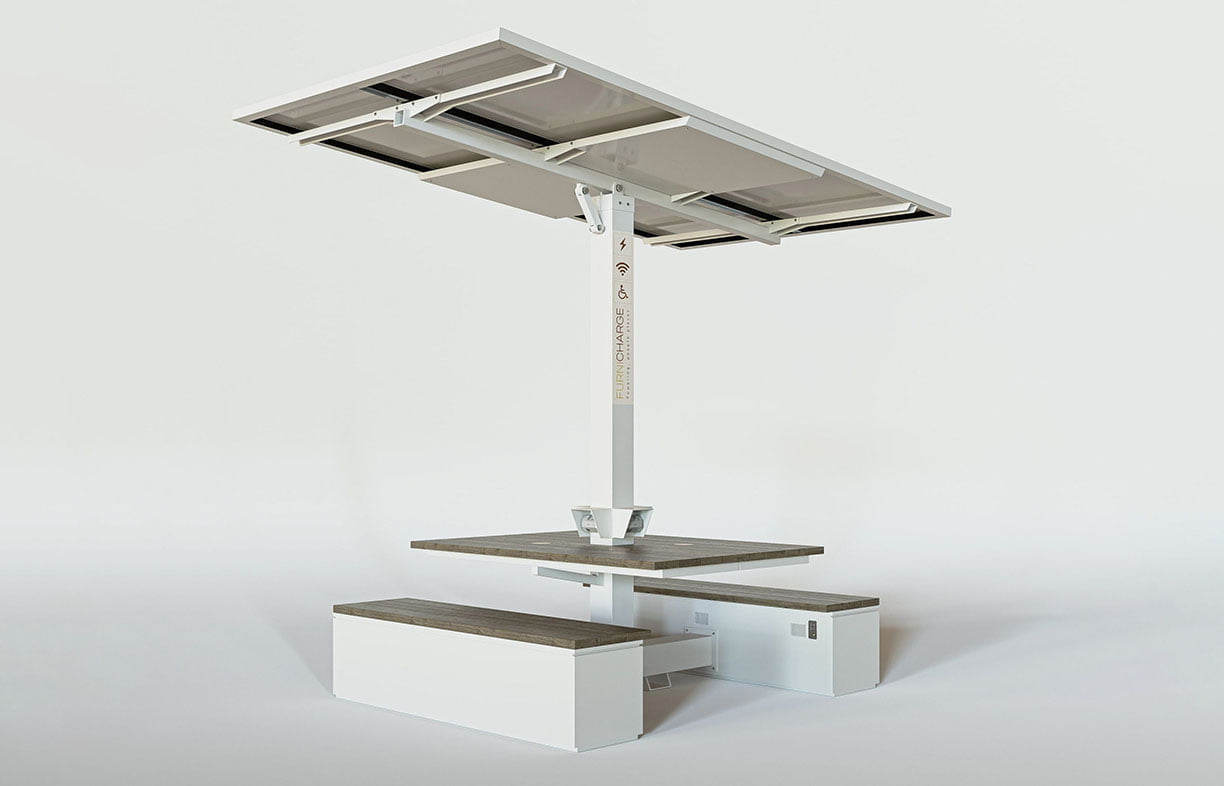 Products
Product profile: Portable solar recharge hubs
Providing device recharging for events or outdoor areas with no access to electricity can be difficult, but the Furnicharge Freedom Hub makes it simple.
Read more