A gas-to-all-electric and EV retrospective in data

Peter Hormann’s household has invested in energy efficiency and converted from gas-electric to all-electric for their 1908 Edwardian home in Melbourne. Having completed the journey a few years ago, his household now has had the lived experience of an all-electric home with an electric vehicle but no battery. So what can be learnt from the last 8 years through data? What might have happened otherwise?
Overview redux
This article is in two parts. Part 1 was published in Renew #168 – “A gas-to-all-electric and EV retrospective and an eye on the future”. It describes our journey and learnings to date, including what’s worked well and what’s not gone to plan. It also introduces some smart home energy concepts, which are more fully described in Part 2.
This Part 2, published online, presents the journey using data regarding cost, usage, and greenhouse gas emissions broken down by major loads and energy sources. It includes comparative bill costs of no-changes using Powershop versus smart renewable energy optimisations associated with Amber Electric wholesale energy pricing. Experimentally, it shows how a home without a dedicated battery can reduce its energy costs and maximise its renewable energy usage in harmony with a growing renewables-dominated electricity grid.
Energy Cost Results
As described in Part 1, our all-electric journey started in earnest in 2017 by installing an electric heat-pump hot water system, upgrading our hydronic heating system to heat pumps, and installing rooftop solar PV. In 2022, we electrified our stove-oven and disconnected the gas mains. As such, 2016 is our last full year with no gas-electric changes, and 2023 was our first full year being all-electric. While intervening years’ data are included, 2016 and 2023 are the comparative and alternative reference years.
Historical Billed Household Energy Costs and Savings
When considering 2023’s household energy usage with no EV charging, our annual gross energy bills have declined in absolute terms by about $300 from 2016. The arguably modest decline is despite 1] 7 years of inflation and market-driven price increases, 2] increased work-from-home energy usage since 2020, and 3] declining feed-in value for excess solar PV energy.
In 2017, feed-in energy revenue was worth $0.118/kWh; using Amber Electric, it was an average of only $0.020/kWh in 2023. The declining feed-in value for excess solar PV generation is inevitable for all households. For some in Australia, the value is already zero or even a cost.
Figure 1 shows the totals and breakdown of our annual gas and electricity bills, including 100% GreenPower and feed-in savings benefit.
Why 100% GreenPower?
Our household has purchased 100% GreenPower for many years, which separately adds ~20% to our grid-sourced energy usage costs. This action has been an important part of our effort to neutralise our climate change-related grid-sourced energy impacts. We have also historically had carbon offset costs included with our household gas usage. For an explanation about 100% GreenPower versus non-green power, see the article in Renew 167, “How green is my power?”.
What value has solar PV returned?
In 2019, we used ~22% of our solar PV energy primarily by proactively time-shifting our hot water, washing machine, and dishwasher loads as much as possible. When we bought an EV and installed a home charger, our solar PV self-consumption doubled to ~45%. Between November 2017 and January 2023, the combined solar PV energy usage value, plus the value of energy fed into the grid, exceeded the purchase price of our solar PV system ($9,600), i.e. a little over five years since its installation. The solar PV savings benefit is shown in the orange box of Figure 1.

What if we made no changes?
Prior to switching to Amber, our preferred energy provider was Powershop, initially selected for its environmental credentials using the Green Electricity Guide by Greenpeace. Given Powershop’s current owner, it would no longer be our preference, but it is helpful for comparative past and alternative cost scenarios. Six-monthly updated comparative unit rates were sourced from the Victorian Energy Compare website.
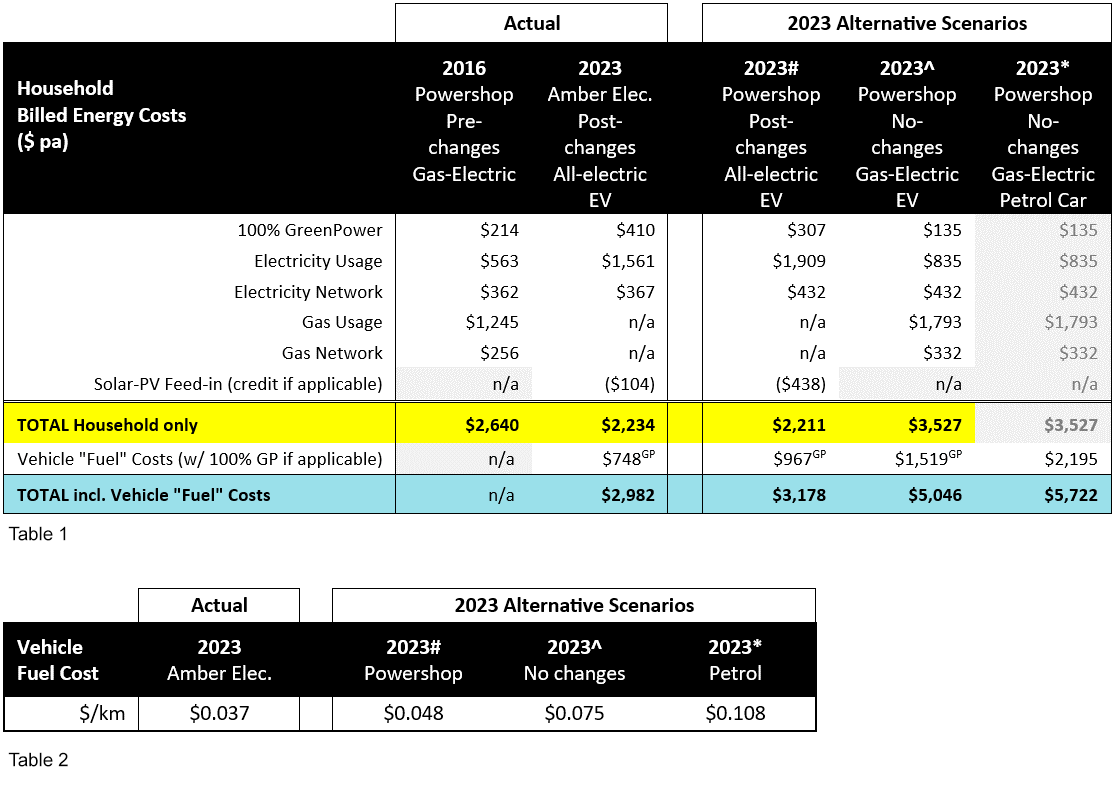
Table 1 (yellow row) shows the actual bill totals for 2016 and 2023, versus 2023 alternative scenarios, all using Powershop. Specific points of note include:
- Considering household energy costs only (i.e., no EV charging), 2023 net bill costs for Amber Electric were on par with Powershop [2023#] despite ~$300 less feed-in benefit with Amber. The feed-in value of Powershop and other retailers will continue declining in the coming years, creating a comparative advantage for Amber Electric users, who can benefit from overall lower energy costs regardless of the feed-in value.
- A 2016 inflation-only (no changes, no solar PV, same 2016 gas-electric usage) alternative scenario [2023^] is calculated as $3,527 and ~$1,300 more expensive than our actual 2023 results.
What’s the value of “fuelling up” an EV at home?
As mentioned in Part 1, we purchased an EV and installed a Zappi 7kW EV charger in April 2020.
Over the last four years, our single-vehicle household has driven ~80,000 km. In 2023, we drove 23,800 km, of which 20,300 km used household energy sources, 33% from our roof and 67% imported from the grid. The net cost (import cost, plus generated energy lost revenue) to drive 20,300 km was $748, including $202 for 100% GreenPower.
Table 1 (teal row) shows that our 2023 household energy costs, including EV charging with Amber Electric, would be cheaper than all three alternative scenarios. In particular, if we had not made any household changes and continued using our Lexus NX Hybrid petrol vehicle for the same distance driven (20,300km, 6L/100km, $1.80/L), our energy costs could have been almost double!
Table 2 shows our comparative fuel cost per driven kilometre for the 2023 actual and alternative scenarios.
How do we use Amber Electric pricing?
Amber Electric’s varying wholesale usage and feed-in prices have consequential use cases that are colour-coded and described for our household, as shown in Figure 2 below. These levels drive automated load management behaviour to consume more, less, or not at all for any given period. Through coloured hallway smart light effects and in-app device messages, the same status information is shared with household users for their interest/action.

Energy Usage Results
With a focus on electricity, our gas and electric energy usage are shown in kWh units, where 1 kilowatt-hour of electricity usage equals 3.6 megajoules of energy.
Historical Billed Household Energy usage
Figure 3 shows our annualised energy journey to all-electric with EV broken down by gas-electricity and billed/generated usage. It also shows how much 1] energy was generated and used, 2] generated and fed into the grid, and 3] the generated excess that was curtailed (triggered by negative feed-in prices).
As reported in the 2019 article, from 2016 gas-electric to 2018/2019 almost-all-electric (gas stove-oven still in use), our total annual energy usage halved. Because of COVID lockdowns and continued working from home during 2020 and the subsequent years, our yearly household energy usage has increased by ~1MWh for additional heating/cooling, lighting, PC/IT, visits to the fridge, etc.

What if we made no changes?
Figure 3 also shows the alternative “no-change” scenario [2023*] with the total gas, electricity and vehicle petrol energy required if we had made no household changes, not installed solar PV, nor bought an EV. In short, compared to doing nothing, our total annual energy usage remains half of what might have been ~30.9 MWh down to 14.7 MWh.
What are the seasonal variations in energy usage?
To show seasonal variations, 2023 monthly usage is broken down into billed and generated sources for our major loads in Table 3. The table also shows an additional breakdown of how the major loads utilised solar PV generated energy and where the excess ended up (feed-in or curtailed). The red-to-white colour coding shows the months with the highest to lowest energy usage across all loads.
What is curtailment?
Curtailment is necessary when feed-in prices are negative (i.e. you pay to export), and the energy market is signalling there’s too much generation relative to the total energy demand. It’s symptomatic of excess uncontrolled rooftop generation exported to the grid regardless of demand. At these times, we do our best to use everything possible. Then, curtailment controls automatically adjust the solar PV inverter generation to the total household load, ensuring that any generated energy that can be used, is used. Sadly, the rest is wasted. As shown in Table 3, in 2023, ~2,800 kWh of energy was curtailed, predominantly during summer. Accepting this is painful, but please read on for a happy ending.
Unit Rate ($/kWh) Results
We live in a Jemena network distribution area and their underlying costs are set on July 1st each year and apply regardless of our chosen electricity retailer. Network distributor costs are also included in the Victorian government-set default offer. Readers in other states and areas will likely have different network distributor costs, meaning comparisons to our costs may only be relative in nature.
In 2023, our average billed unit rate (excluding 100% GreenPower costs) for all imported energy was $0.21/kWh. For comparison, the 2023 Jemena Victoria Default Offer (VDO) unit rate was $0.3252/kWh and Powershop’s average quoted unit rate was $0.264/kWh. Despite significant wholesale energy market volatility, we managed to beat both.
Table 4 shows our average 2023 unit rates achieved by each load, where lower rate outcomes represent higher degrees of price-driven control to use more green energy.
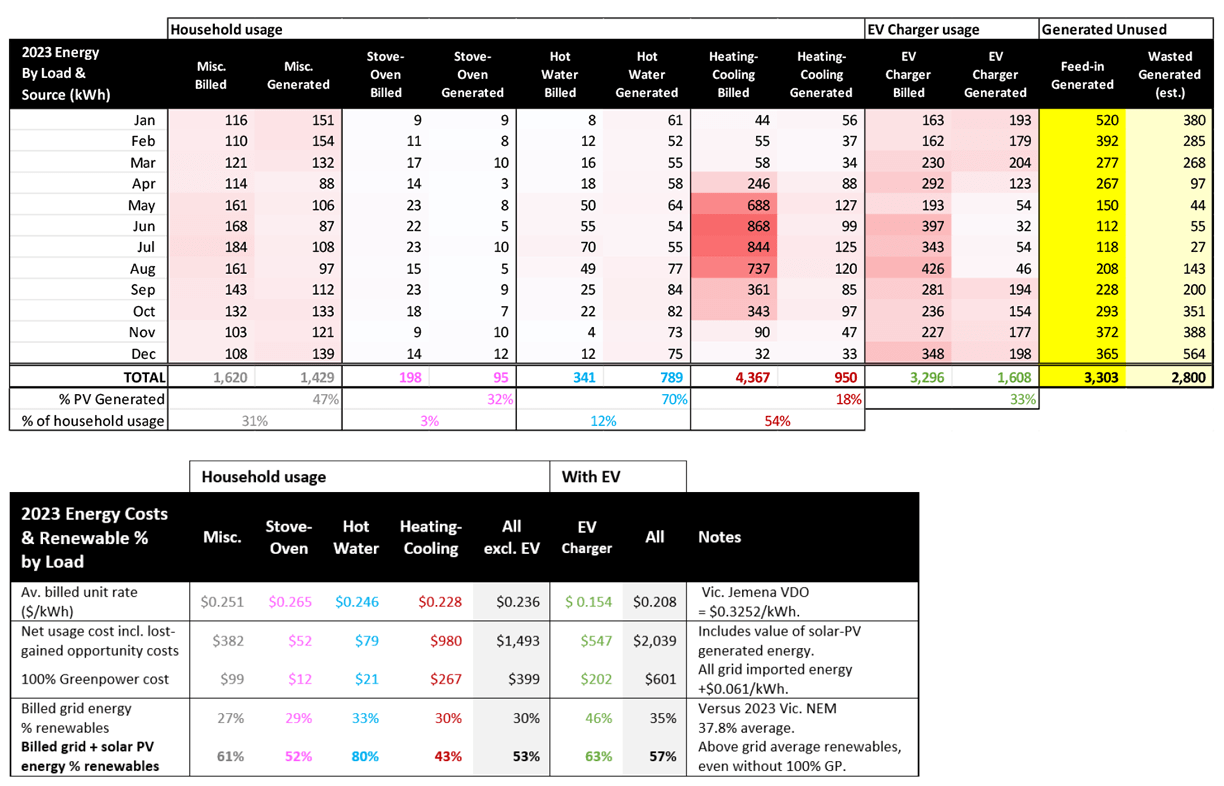
Table 4 (bottom): 2023 Load-based energy usage, costs, rates and renewable percentages.
Renewable Energy Results
Table 4 also shows the percentage of billed grid-sourced renewable energy by load and all totals versus the Victorian NEM average of 37.8% renewables in 2023. Also shown is the total % renewable energy (grid sourced + our solar PV generated) achieved by shifting our load usage to times when energy is the greenest.
For each load, the benefit of shifting our usage to lower-priced renewables-dominated times has made a difference, especially considering we don’t use much grid-sourced energy when the grid itself is at peak renewables, i.e. when we’re generating/using our own 100% renewable energy.
Greenhouse-Gas (GhG) Emission Results
In the absence of purchasing 100% GreenPower, our household’s GhG emissions would have been determined by the Emission Factors (EF) for 1] gas distributed in a pipeline and 2] the mix of generated fossil-fuelled and renewable electricity provided to the Victorian part of the National Energy Market (NEM). EFs for electricity in Victoria have historically been the highest in the nation but have steadily declined with increasing commercial and household renewable energy-related generation.
In FY23, Victoria’s electricity EF was 0.85 kg CO2-e/kWh, down from 1.13 in FY16. The EFs for other states and territories are all different, and in FY23, the national average was 0.65 kg CO2-e/kWh. The lowest is Tasmania, which is 0.12 kg CO2-e/kWh given the dominance of hydroelectric and wind power generation.
The EFs for gas (per GJ), petrol (per Litre), and Victorian electricity are shown in the Chart 4 tables below. These and other fuel-type-dependent EFs are available from the Federal Department of Climate Change, Energy, the Environment and Water.

Some readers will be surprised to see that a switch from a gas-electric to an all-electric household in Victoria would, until recently, have increased climate-impacting GhG emissions, even with rooftop solar PV generation. A key factor is the comparatively low EF for gas (distributed in a pipeline) at 0.1855 kg CO2-e/kWh, where extraction and fugitive gas losses are separately accounted for by the gas producer. Also, for us, it is the hydronic heating system performance, where a reverse-cycle AC coefficient of performance otherwise compensates for higher electricity grid emission factors.
Without 100% GreenPower, our GhG emissions would have risen in line with our increase in electricity usage. Notably, with decreasing Victoria electricity EFs, our total household energy usage with EV charging is now on par and reducing compared to our fossil-fuelled 2023 alternative scenario [2023*]. Most all-electric households in other states and with reverse-cycle AC will already be below this threshold.
Conclusion
From my perspective, a household battery is an expensive discretionary appliance that enables users to automatically move energy to preferable time periods. We have achieved something similar by shifting our major loads to periods of lower cost and more renewables. In effect, our major household loads (technically known as Distributed Energy Resources DER) are batteries of energy stored in other forms. This includes a battery for hot water, a battery for heating and cooling in our house, and a battery on wheels. While our house is a leaky battery (but improved by double-glazing, insulation, and draught-proofing) and can’t discharge to the grid, our results demonstrate what can be achieved without a major capital purchase. Like any battery, we have “charging losses” (e.g., for pre-heating/pre-cooling) that are not too dissimilar to a physical battery – e.g., about 5% to 10%.
Our “Home as a Battery” approach with essential demand-response automation has enabled us to reduce our annual energy costs relative to an otherwise favoured retailer such as Powershop and beat the Victorian Default Offer unit rate (both for Vic. Jemena). We could only have achieved this outcome with a smart home energy management platform that has delivered value beyond manual control and time-of-day programming alone. In addition to reduced energy costs, we have also fulfilled our aims to be more grid-renewables friendly. Maybe our experiment was simply lucky in 2023, so only further time will tell.
Despite the overall positive outcomes, the curtailed wasted energy has pained me. In the first few months of 2024, I have been experimenting with a concept I call the “Community is my Battery”. I have befriended a neighbour to charge their EV in our carport on days when our generated energy would otherwise be curtailed (i.e. we can’t use it). While a neighbour or two more will be helpful to cover all the excess opportunities, with just one EV on call, we’ve avoided wasting (or paying to export) $6.32 of energy. I gave my neighbour 212kWh of EV charging for his service and enough energy to drive about 1,000 km. It’s a win for me (reducing my waste), a win for them (free fuel), a win for the community (helping each other), and ultimately a win for the environment (avoiding charging from the grid). That’s the happy ending.
Read Part 1 of this article in Renew 168.
Our electricity usage insights are based on actual billed costs and usage read from our utility smart meter, for which our yearly billing period is from 21 January to 22 January. Amber also provides a downloadable monthly half-hour usage and cost report.
Further load usage information comes from a Solar Analytics monitoring device and service. The kWh accuracy of the Solar Analytics monitoring versus our smart meter billed data is within 1% to 4% accuracy in any given month.
The Solar Analytics, 5-minute interval energy data, is downloaded and processed in a spreadsheet to produce the kWh usage and generation for the four major loads of hot water, heating-cooling, stove-oven and EV charging. Any other energy used is assumed miscellaneous and includes the refrigerator, washing machine, lighting, small appliances, TV/media, IT/network devices, etc. Based on a usage apportionment methodology, major load energy is further broken down by grid-sourced (what’s billed) and solar PV generation sourced.
To calculate the billed costs for each load, the 5-minute usage intervals are multiplied by Amber Electric’s interval rates ($/kWh) to determine billed costs by load type. Similarly, the value of the generated energy usage cost is the Amber half-hour feed-in rate ($/kWh), which is the lost opportunity revenue otherwise earned (or sometimes paid for) if the energy was exported.
The allocation of solar PV energy to the loads were mathematically apportioned based on a hierarchy of priorities with the assumption that miscellaneous uncontrolled usage consumes any available solar PV generated energy first, then the stove-oven, hot water, heating-cooling and lastly, EV charging. Related to our price-responsive automation, ordering is considerate of the level of discretion for each load type, where EV charging has the most discretion, followed by heating-cooling. Hot water has some discretion, but ensuring the family has a hot shower even on the cloudiest of days is a “non-negotiable”. We also typically need to cook in the early evenings when the generation is low and prices can be higher. Discretion, in this sense, is the automated ability to prioritise 1] the use of as much solar PV generated energy as possible by shifting load usage in a prioritised order to suit, and 2] shifting load usage away from grid high-price periods (e.g. evening and morning peaks) including pre-heating or pre-cooling when energy is cheaper.
Further reading
 All-electric
Mandatory disclosure of energy ratings on the horizon
Graham Hunt introduces us to a soon-to-be-implemented national framework that will be a massive win for renters and homebuyers.
Read more Efficient homes
Tradies and the transition
Do we need as many tradies for electrification as many think? Not if we are innovative, writes Alan Pears.
Read more Efficient homes
Double glazing on the (very) cheap
Do we need as many tradies for electrification as many think? Not if we are innovative, writes Alan Pears.
Read more

